The first thing you need to do is install Visual Studio 2015 (Community, Professional or Enterprise) and Windows 8.1 or Windows 10. You can follow the installation instruction from the official link.
Once installed, you can debug your Wave Engine games with Visual Studio. Open your game project on Visual Studio and disable video support from App class on the launcher project:
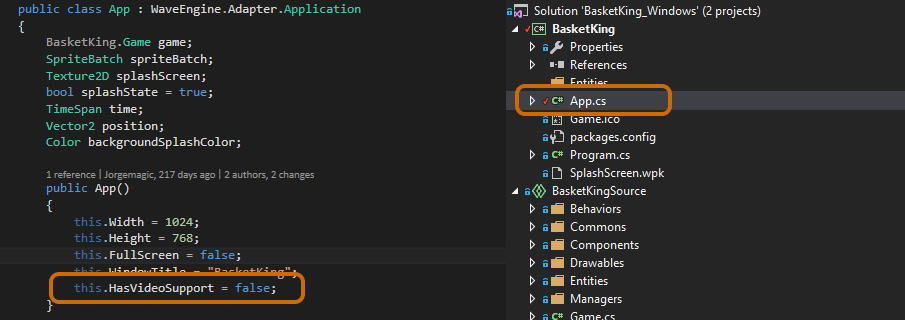
Important: This property will be available on the next 2.2.0 Wave Engine release, although you can download and try with 2.1.2-alpha nightly nugets packages.
It is necessary to disable the video because this feature sets up some attributes on the DirectX configuration that are incompatible with the diagnostics tool.
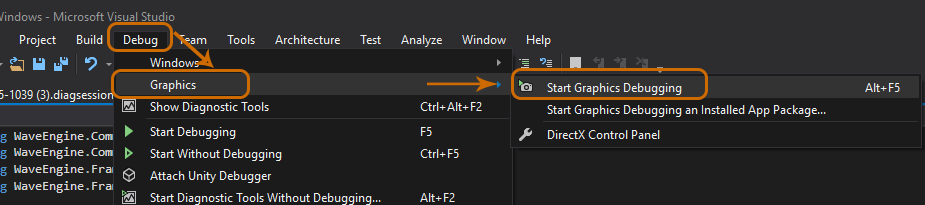
Start the diagnostic tool from Visual Studio Debug-> Graphics -> Start Graphics Debugging.
You can see your game running while Visual Studio shows Frame time and Frame per second charts.
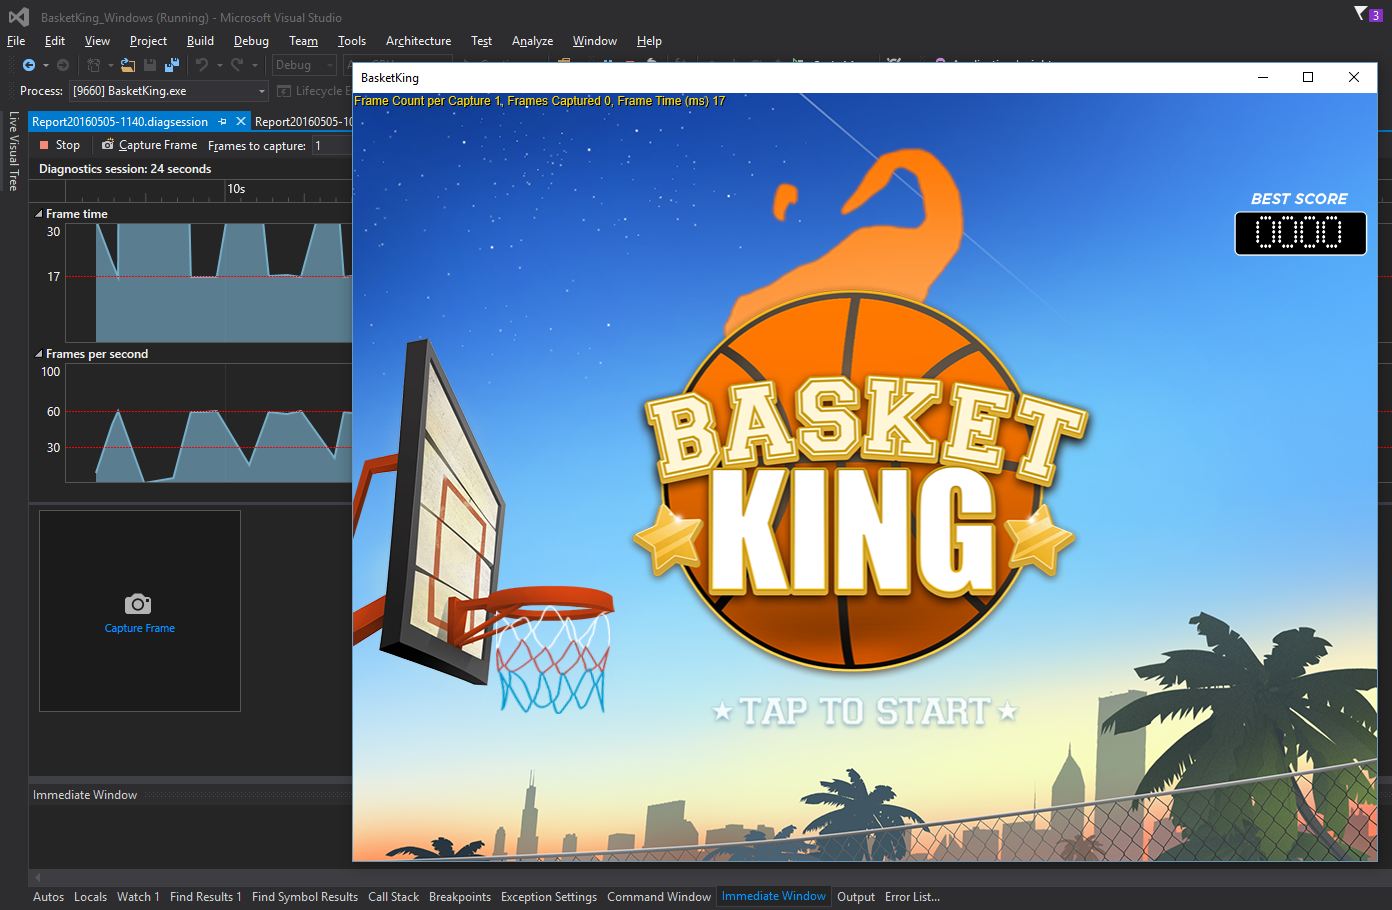
Click on Capture Frame button to collect data and then click on stop diagnostics button.
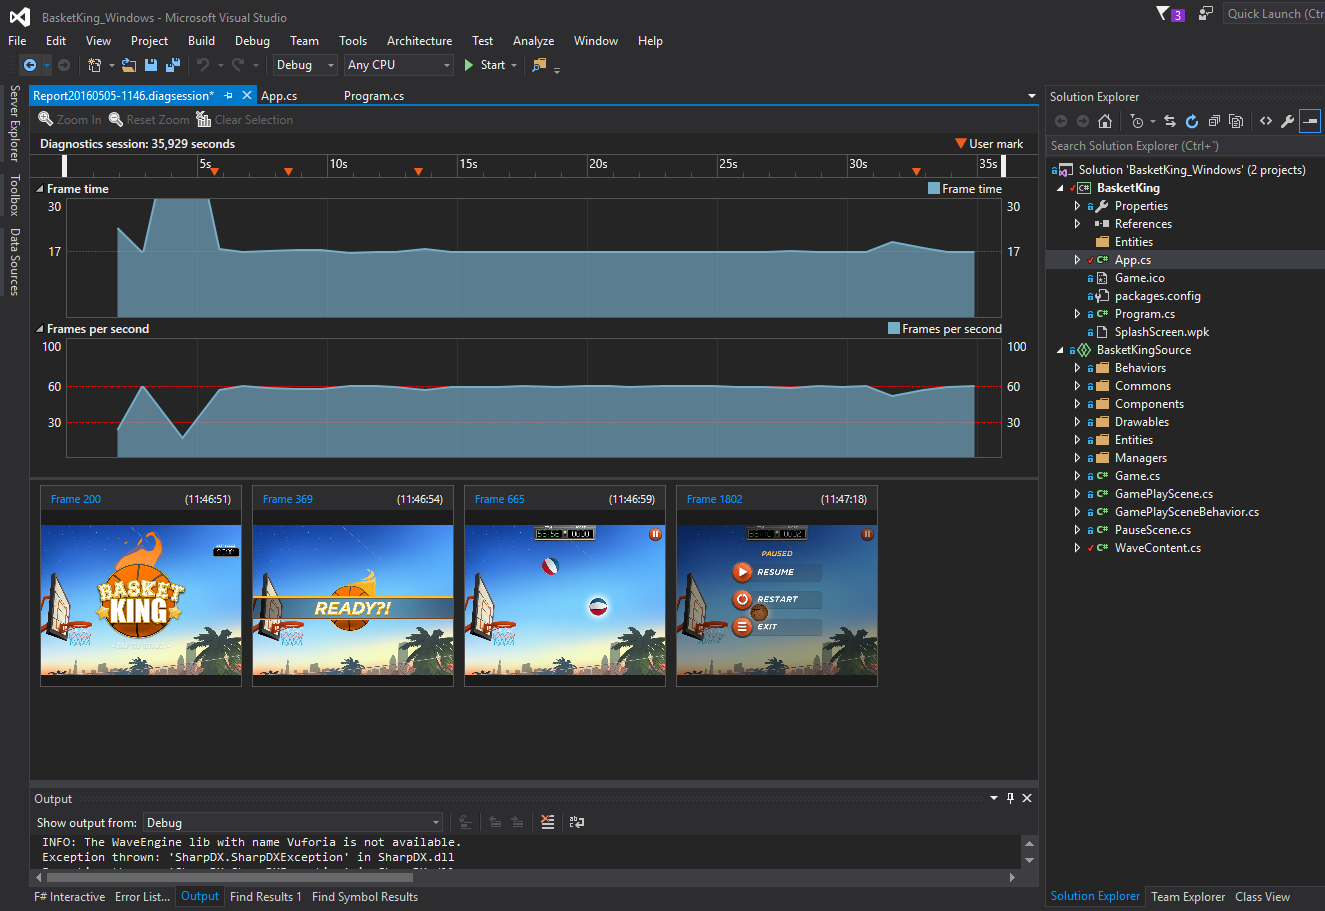
Click on frames captured to open Visual Studio Graphics Analyzer
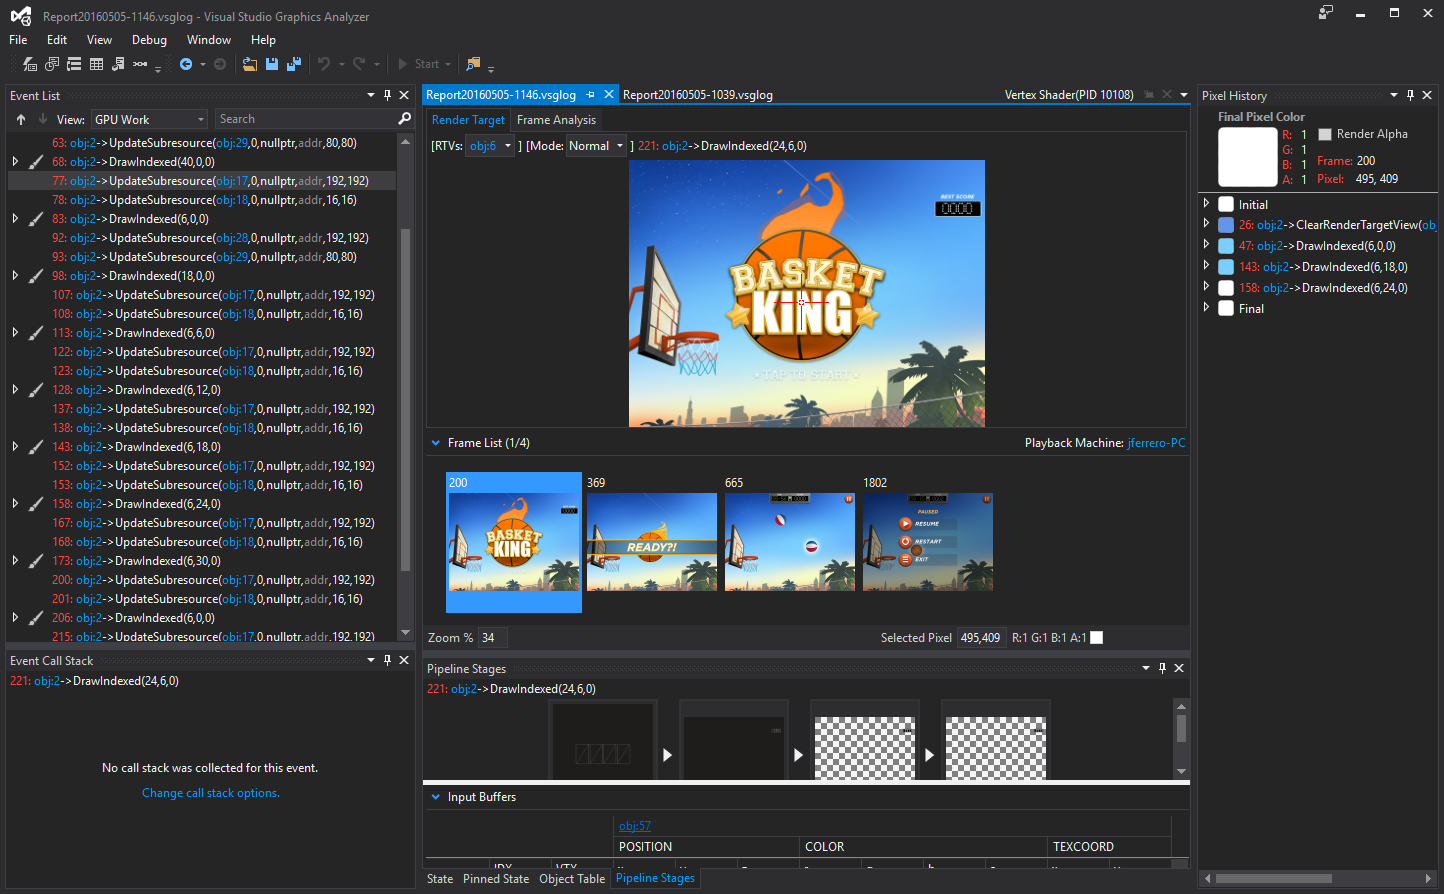
All panels can be opened from the toolbar

Event List Panel shows the draw call list that were necessary to draw the whole Frame.
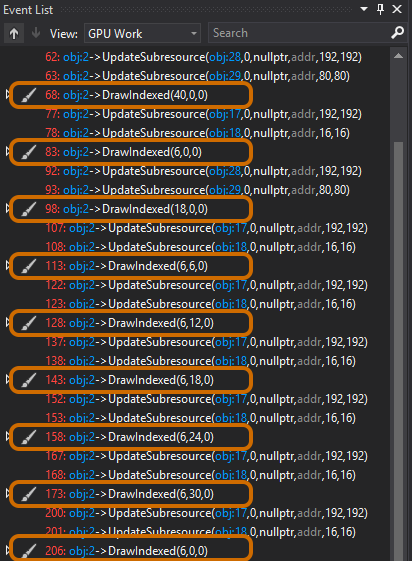
The draw call number and time spent are directly involved with game frame rate, so it is very important to analyze this data.
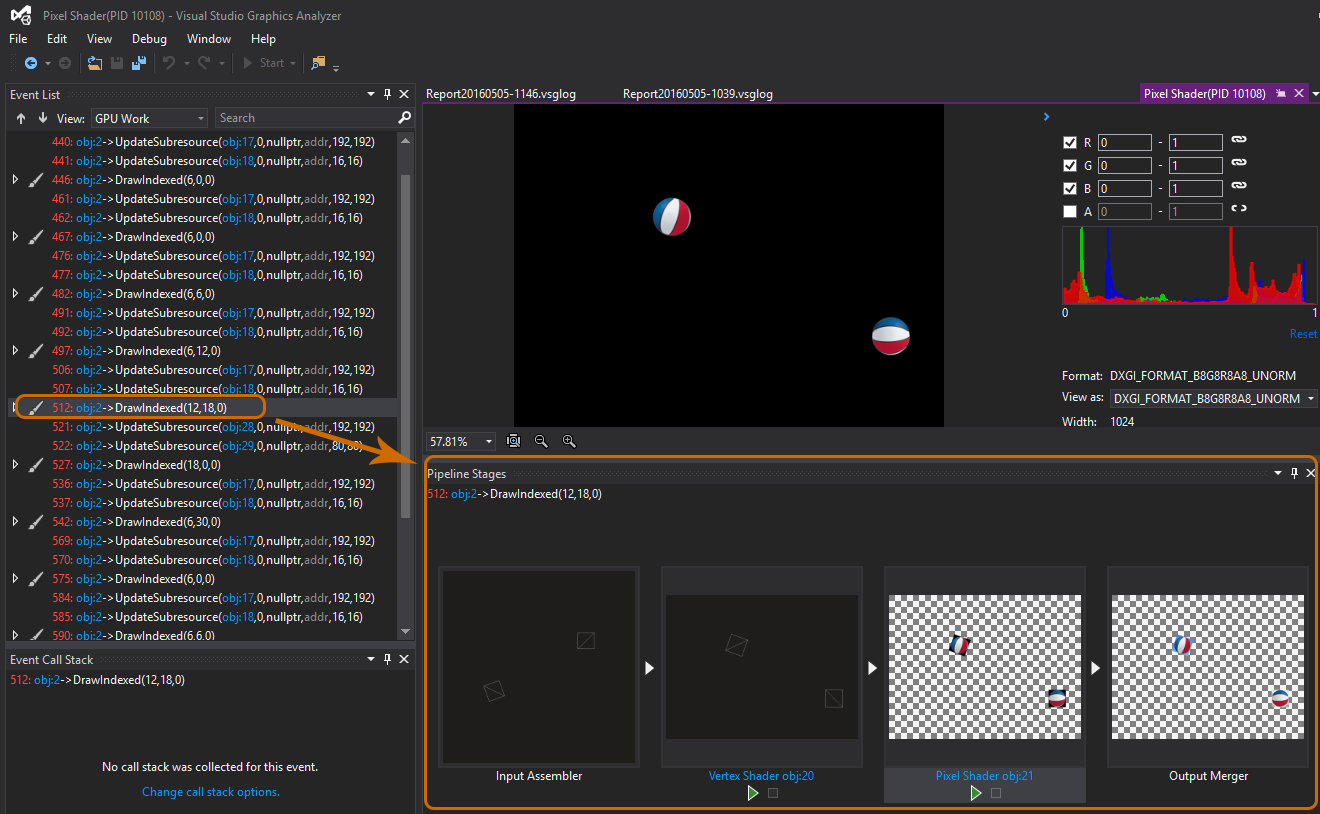
You can analyze the stages on a selected draw call open Pipeline Stages panel:
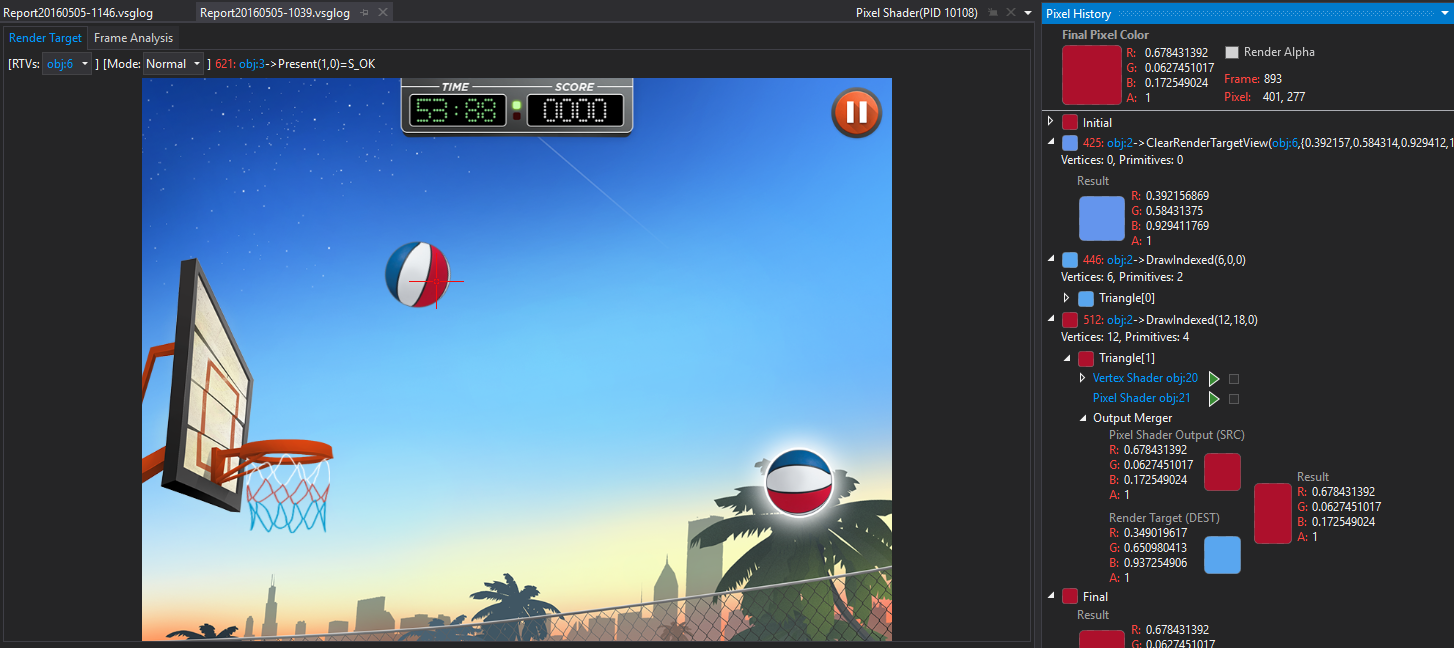
Another interesting thing is the Pixel history panel where you can select a pixel click on the Render Target and then this panel shows the history colors after the different draw calls:
And finally, Frame Analysis tab shows a table with time spent by draw call and shades red the higher draw calls:
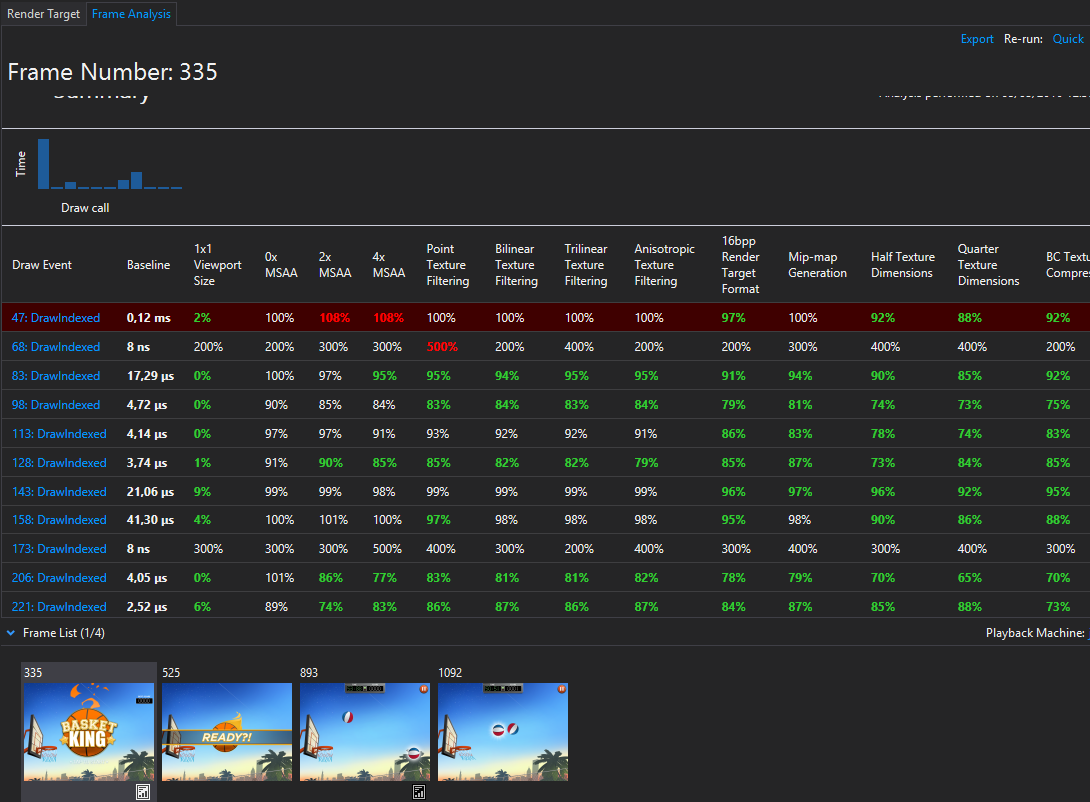
(Note. In this example, the highest draw call was to draw the background)
In conclusion, Visual Studio Graphics Diagnostics is a very powerful tool that will help you to analyze and optimize the performance of your game. If you wish to know more about this tool, you can read the extended documentation here.